Introduction
This project corresponds to my master’s thesis. The aim of the research was to evaluate the feasibility of using a microphone and a triaxial accelerometer to detect and classify both structure- and air-borne vibrations during the connector insertion process. Due to the lack of public datasets, I created my own dataset consisting of 2064 insertion attempts performed by an industrial robot, along with 37 minutes of impulsive noise recordings.
I evaluated five impulse detection algorithms, four of them achieving detection rates above 99%. Then, by applying data augmentation techniques, I generated nine datasets with varying noise conditions to train and optimize convolutional neural networks using individual features. The best features (MFCC, log-mel spectrogram, and delta log-mel spectrogram) were combined into multimodal models, achieving an accuracy of 98.90% on noise-free data and 95.39% even with severe white noise (SNR of -10 dB). During validation, the classification model reached an accuracy of 99.04%, with only five misclassifications out of 522 insertion attempts.
The results demonstrated that the use of accelerometers and a multimodal approach can significantly improve classification accuracy and greatly reduce sensitivity to impulsive noise. The best classification result was achieved by combining MFCC features extracted from the signals of two axes of the triaxial accelerometer.
Sound event detection
A Sound Event Detection (SED) system is a technology designed to automatically identify and classify specific sounds within an acoustic environment. A particular case is the detection and classification of impulsive sounds, which are characterized by their very short duration, abrupt onset, and high concentration of energy in a brief time interval. The “click” generated during the automated insertion of a connector clearly fits these characteristics.
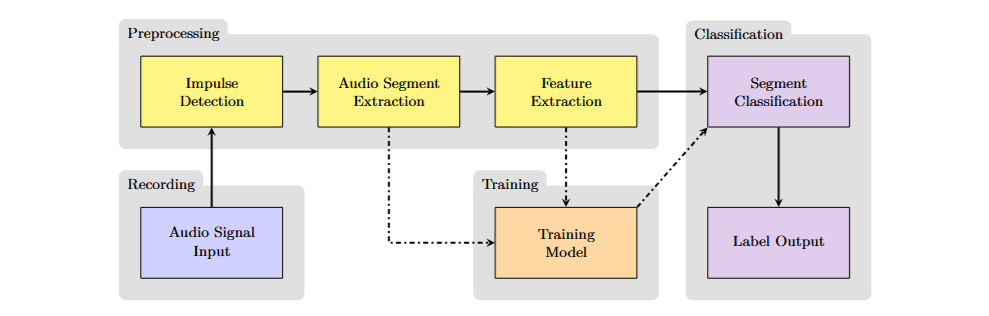
A typical impulsive sound detection system operates through a cascaded processing flow that isolates, analyzes, and classifies only the relevant segments of the signal. The signal is continuously monitored while an impulse detection algorithm analyzes it in real time to identify the moments when a brief, high-energy event occurs. For this task, there is a wide variety of algorithms available, many of which are based on evaluating the Root Mean Square (RMS) of the segmented and normalized signal, as well as other more complex parameters.
When an impulse is detected, a small segment of the signal around the event is clipped. The raw signal has high resolution and, therefore, a large number of samples, making it unsuitable to be used directly as input to the classification model. For this reason, features are extracted from the raw audio, which describe its properties in a more compact and representative way. Among the most common features are various spectrogram variations (log-mel, delta log-mel, etc.) and Mel Frequency Cepstral Coefficients (MFCC). In this project, I also considered three time-domain features.
Finally, the features extracted from the signal segment are classified into predefined categories. For this step, convolutional neural networks have demonstrated high performance in previous research.
Data acquisition
Since no suitable public datasets exist for acoustic quality monitoring in automated connector insertion processes using vibration sensors, I created my own dataset. In total, I collected recordings from 2064 insertion attempts performed by an industrial robot, including both successful and failed cases.
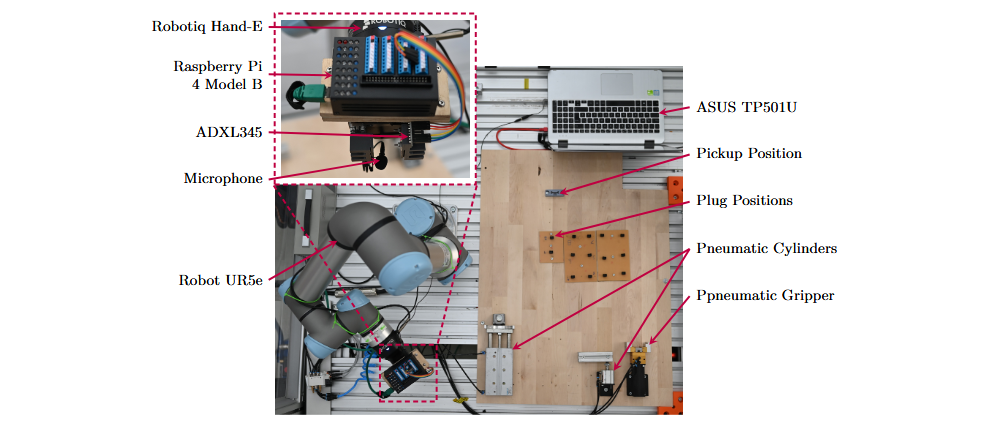
The experiments were conducted using a Universal Robots UR5 collaborative robot. The end effector was the Robotiq Hand-E adaptive gripper. The gripper fingers were specifically designed for the type of connector used (Hirose DF51K) and manufactured using stereolithography. For data acquisition, I used a Rode Lavalier GO microphone and an Adafruit ADXL345 triaxial accelerometer. In each insertion attempt, the robot picked up a male DF51K connector and inserted it into its corresponding female connector. To increase recording variability, I used a total of 58 male connectors and 29 female connectors.
Typical impulsive noise found in industrial environments was simulated by hitting the base with different objects and using three pneumatic actuators, which were operated randomly and independently. In total, 37 minutes of impulsive noise were recorded.
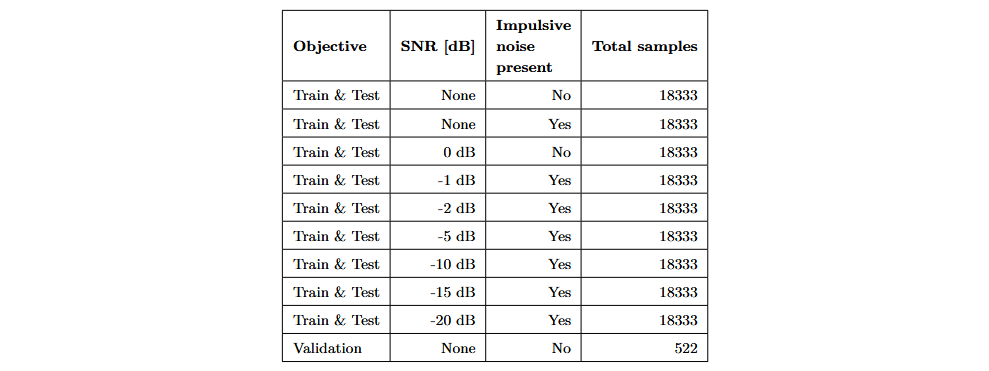
To improve the robustness of the classification models against background noise, I applied data augmentation techniques such as time shifting and adding white noise. This allowed the creation of nine augmented datasets, each with different combinations of insertion sounds and vibrations, impulsive noise, and white noise. These datasets were used to train and optimize the classification models. The augmented data was split into 70% for training and 30% for testing. Finally, I recorded an additional 522 insertions to validate the performance of the trained models. The following table shows the datasets created:
Impulse detection
The ideal impulse detection algorithm would accurately identify the clicks produced during successful insertion attempts while minimizing the detection of irrelevant noise. In this project, I evaluated five algorithms for the detection of impulsive events:
- Median Filter
Applies a nonlinear filter to the raw signal and detects an impulse when the filtered value exceeds a predefined threshold. - Normalised Power Sequence
Calculates the signal energy in successive windows, normalizes it, and detects impulses by analyzing the standard deviation within each window. A low standard deviation indicates the presence of an impulsive event. - Threshold on Power Sequence
Based on computing the signal power and applying a dynamic threshold. If the power exceeds the threshold, an impulse is registered. - Wrapped Linear Prediction (WLP)
Applies a predictive model that estimates the next signal values based on past samples. Impulsive events are detected when the difference between the actual and predicted signal exceeds a specified threshold. - Maximum RMS
If the connector insertion is robotized, it’s possible to start recording at the beginning of the insertion movement and stop at the end. Therefore, it may also be viable to analyze the recording after it finishes. This algorithm assumes that the point with the maximum RMS value within the recording corresponds to the relevant impulsive event.
The algorithms were applied to the recordings without data augmentation. These include successful insertions, failed attempts, and impulsive noise.
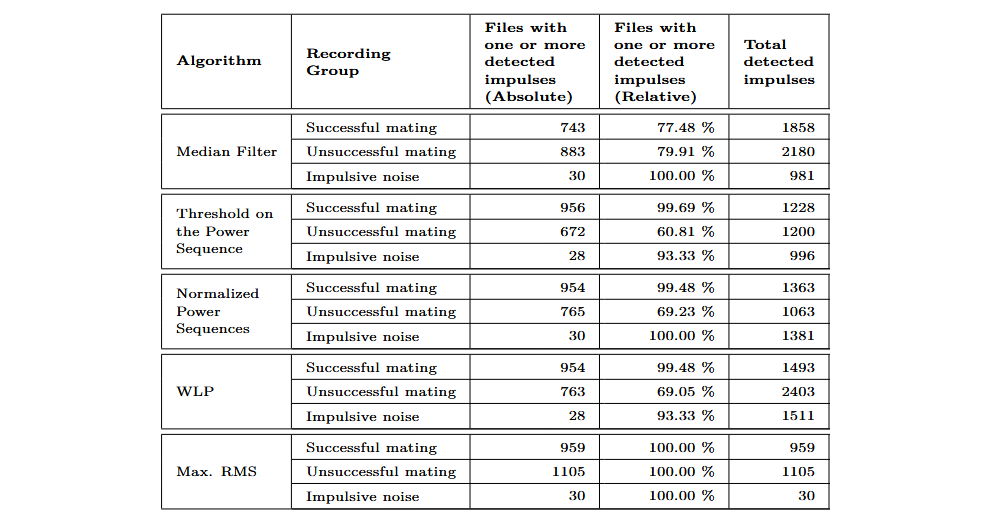
When evaluating the results of the maximum RMS algorithm, it is important to note that it identifies only a single impulse per recording. Therefore, when applied to longer recordings containing background impulsive noise, it generates just one timestamp. Due to the design of this algorithm, it achieves a 100% recognition rate as long as the RMS values of the background noise do not exceed the maximum RMS values of the clicks produced during successful insertion attempts.
The algorithm with the poorest performance in terms of detection rate is the median filter, which achieved 77.48% on recordings of successful insertions—significantly lower than the other algorithms compared. The WLP, threshold on the power sequence, and normalized power sequence algorithms all showed detection rates above 99%. Regarding sensitivity to impulsive noise, the threshold on the power sequence algorithm performed best, detecting 996 impulses in the impulsive noise recordings and correctly identifying 39.19% of failed insertion recordings with no impulse detected.
Classification model
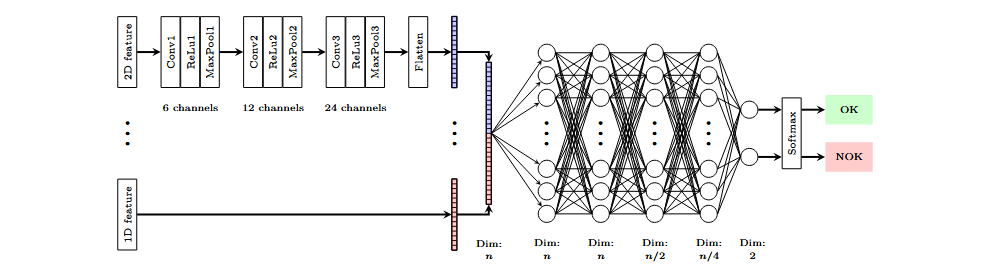
The classification model used employs a multimodal architecture, where features are processed in parallel through convolutional layers. The feature maps extracted by these layers are concatenated, and the resulting vector is fed into a multilayer perceptron (MLP) that performs binary classification. The model is modular, allowing its structure to be adjusted according to the size of the input features. This enables combining features of different dimensions and sizes from various sensors to classify the event.
Individual attributes
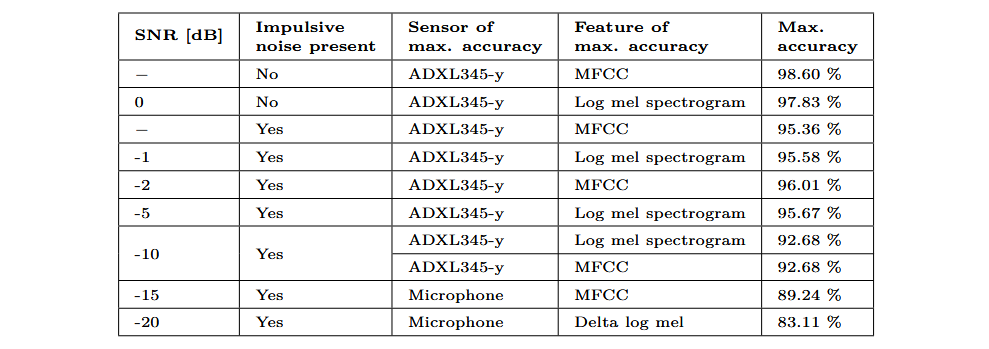
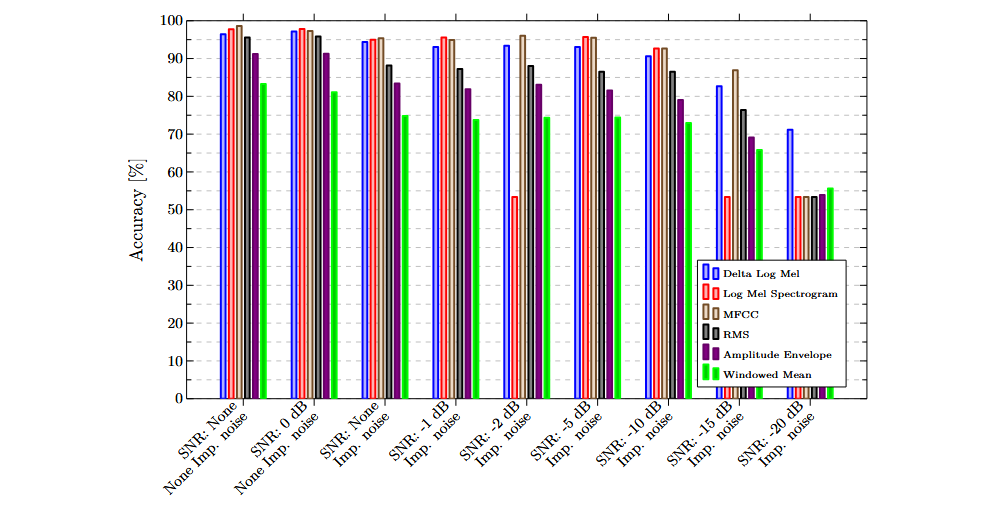
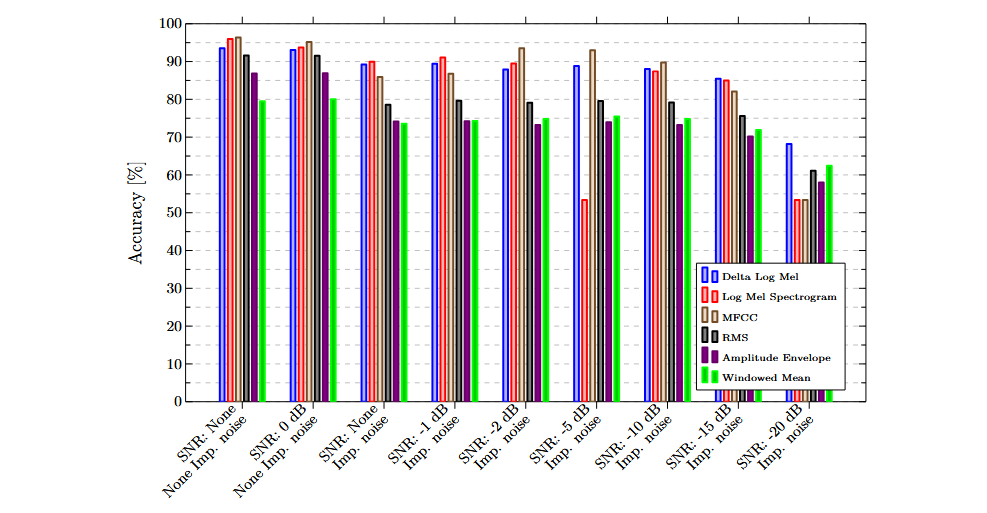
In total, I evaluated six individual features: log-mel spectrogram, delta-log-mel spectrogram, MFCC, RMS, amplitude envelope, and windowed mean. Each feature, extracted from a specific sensor, was used as the sole input parameter in the classification model described above. The following table shows the best results obtained for each dataset, along with the sensor-feature combination that achieved each result.
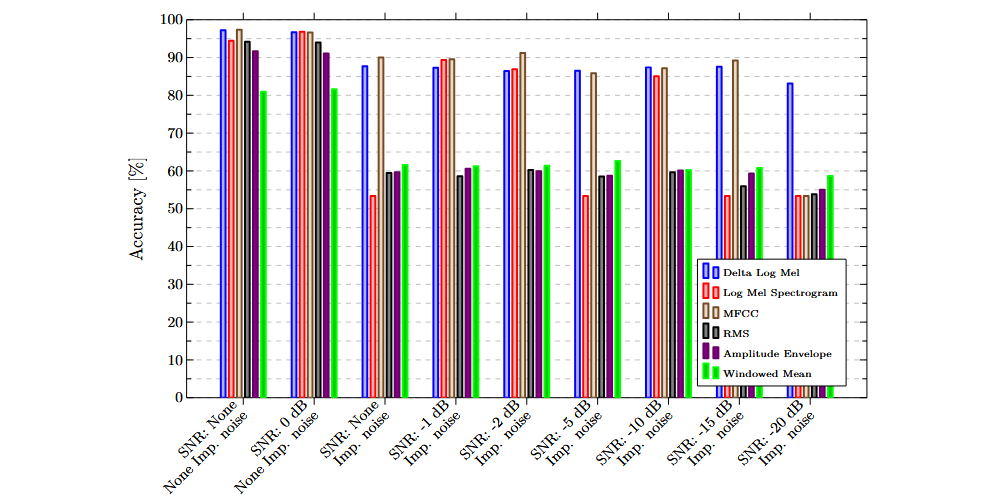
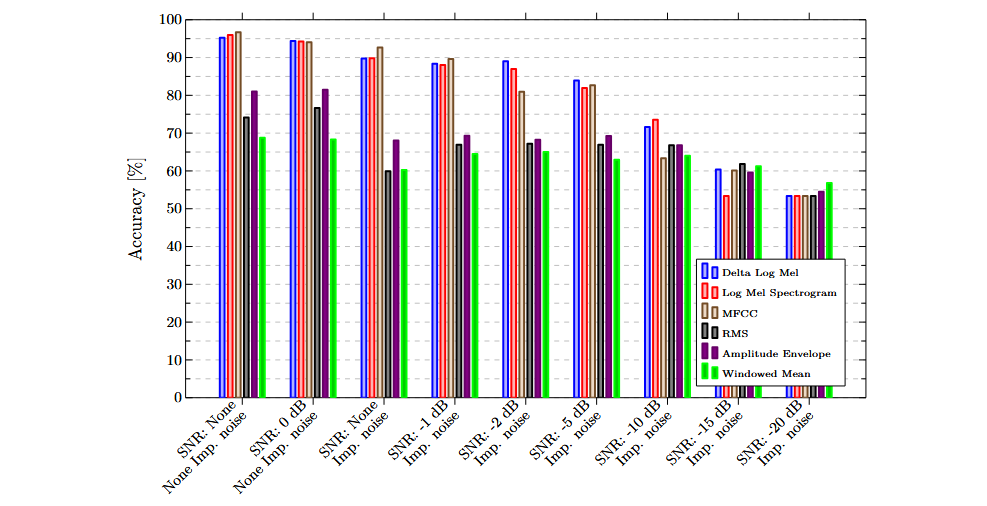
The following charts illustrate the results obtained using individual features and sensors. In general, frequency-based features outperformed purely temporal ones, demonstrating a greater ability to discriminate between successful and failed insertions.
Multimodal classification
After evaluating classification using individual features, I compared models trained with pairs of features. In total, I selected 14 combinations, using MFCC, log-mel, and delta-log-mel spectrogram features. These features were chosen due to their significantly better results compared to temporal-domain features in the individual evaluations. Due to the particularly high performance of the ADXL345 sensor on the y-axis, it was used in all combinations. The following table shows the selected combinations and the average results obtained. The table values represent the mean results across the nine datasets considered.
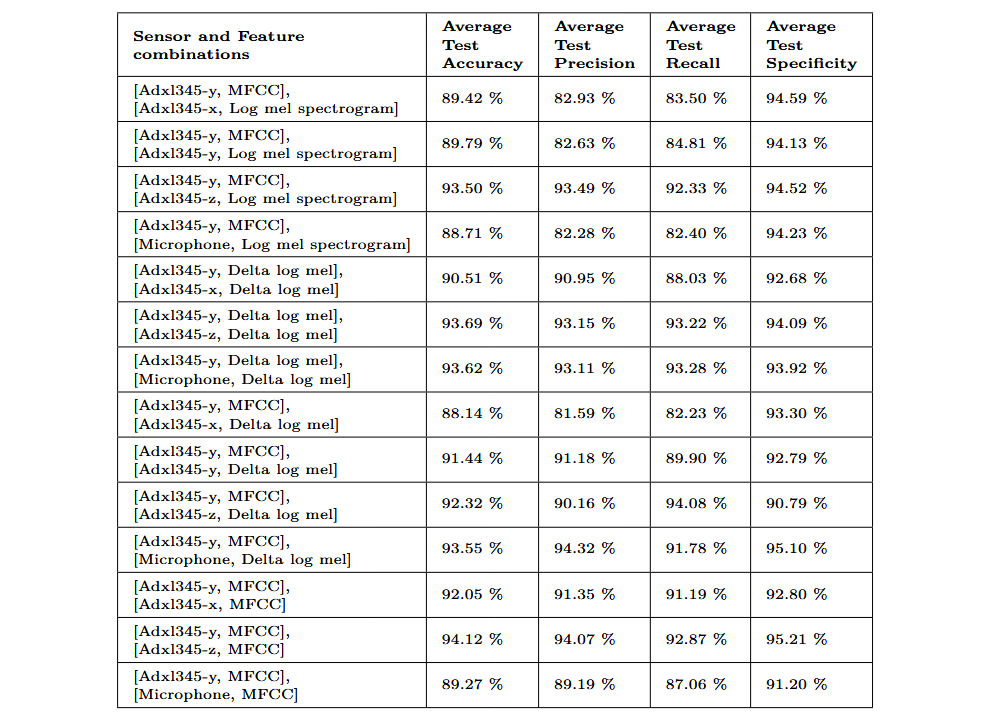
The combination [[ADXL345-y, MFCC], [ADXL345-z, MFCC]] achieved the highest accuracy and specificity values, making it the preferred combination. The following graph shows the results obtained with this combination for each of the evaluated datasets. A notable improvement is observed compared to the results achieved using a single feature.
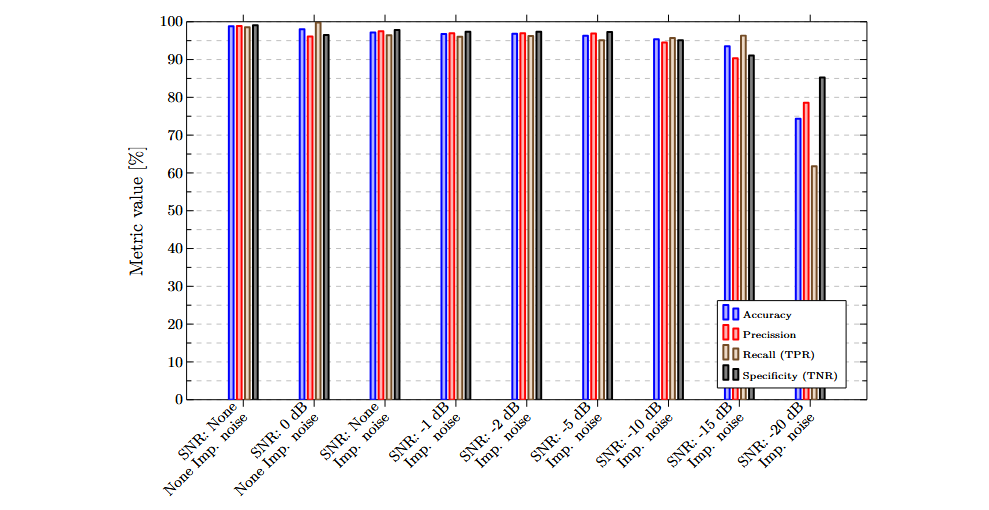
A low sensitivity to impulsive noise can be observed. The difference in accuracy between the dataset without impulsive noise and with white noise (SNR = 0 dB), and the dataset without white noise and with impulsive noise, is only 0.84%. Precision and specificity show improvements of 1.35% and 1.33%, respectively, in the dataset with impulsive noise. Recall decreases by 3.32%.
Furthermore, the model trained with this combination of features is highly robust to white noise. For all datasets with an SNR down to -10 dB, accuracy remains above 95%. Even at an SNR of -15 dB, all metrics stay above 90%.
Validation
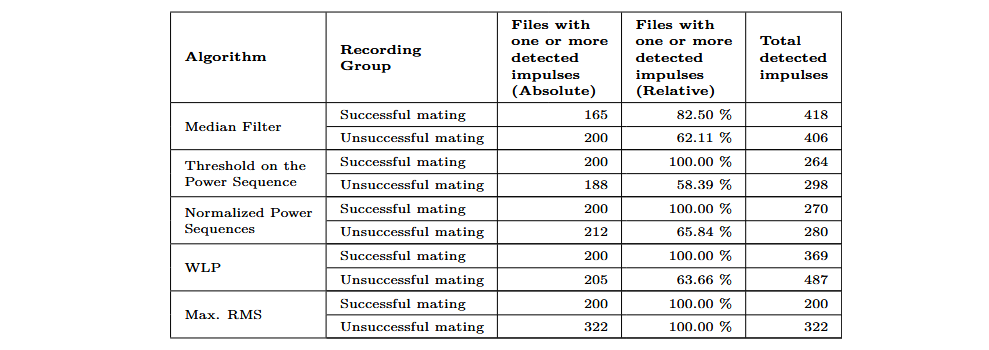
The following table shows the results obtained with the five impulse detection algorithms applied to the evaluation recordings. Except for the median filter, all algorithms detected 100% of the impulses in successful insertion attempts.
The following table presents the validation confusion matrix. The selected model uses the feature combination [[ADXL345-y, MFCC], [ADXL345-z, MFCC]]. This model was optimized using the dataset without white noise and with impulsive noise. Out of the 522 validation recordings, five were misclassified: two positive samples were categorized as negative, and three negative samples were classified as positive. The resulting metrics are as follows:
- Accuracy: 99,04 %
- Recall: 98,51 %
- Precision: 99,00 %
- Specificity: 99,38 %